Use the debugger in Android Studio
Before you begin
This codelab teaches you how to use the debugger in Android Studio to inspect what happens in the Dice Roller app at runtime.
The debugger is an essential tool that lets you inspect the execution of the code that powers your Android app so that you can fix any bugs in it. It lets you specify points at which to suspend the execution of the code and manually interact with variables, methods, and other aspects of the code.
Prerequisites
Basic familiarity with Android Studio
Ability to create and run a basic Jetpack Compose app in Android Studio
Completion of the Create an interactive Dice Roller App codelab
What you’ll learn
How to attach the debugger to an Android app.
How to launch an app with the debugger attached.
How to use some fundamental features of the debugger.
What the debugger is typically used for.
What you’ll need
A computer with Android Studio installed
The solution code for the Dice Roller app in Compose
Eye Power
Starter code
https://github.com/google-developer-training/basic-android-kotlin-compose-training-dice-roller
Branch: main
Clone:
$ git clone https://github.com/google-developer-training/basic-android-kotlin-compose-training-dice-roller.git
Run the debugger
There are two ways to run the debugger alongside your app:
Attach the debugger to an existing app process that runs on a device or emulator.
Run the app with the debugger.
Both ways accomplish the same thing to a certain extent. Once you’re familiar with both ways, you can pick the one that you prefer or whichever one is required.
Attach the debugger to an app process
First, run your app.
Click Attach Debugger to Android Process.
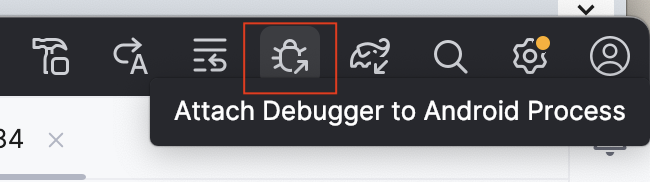
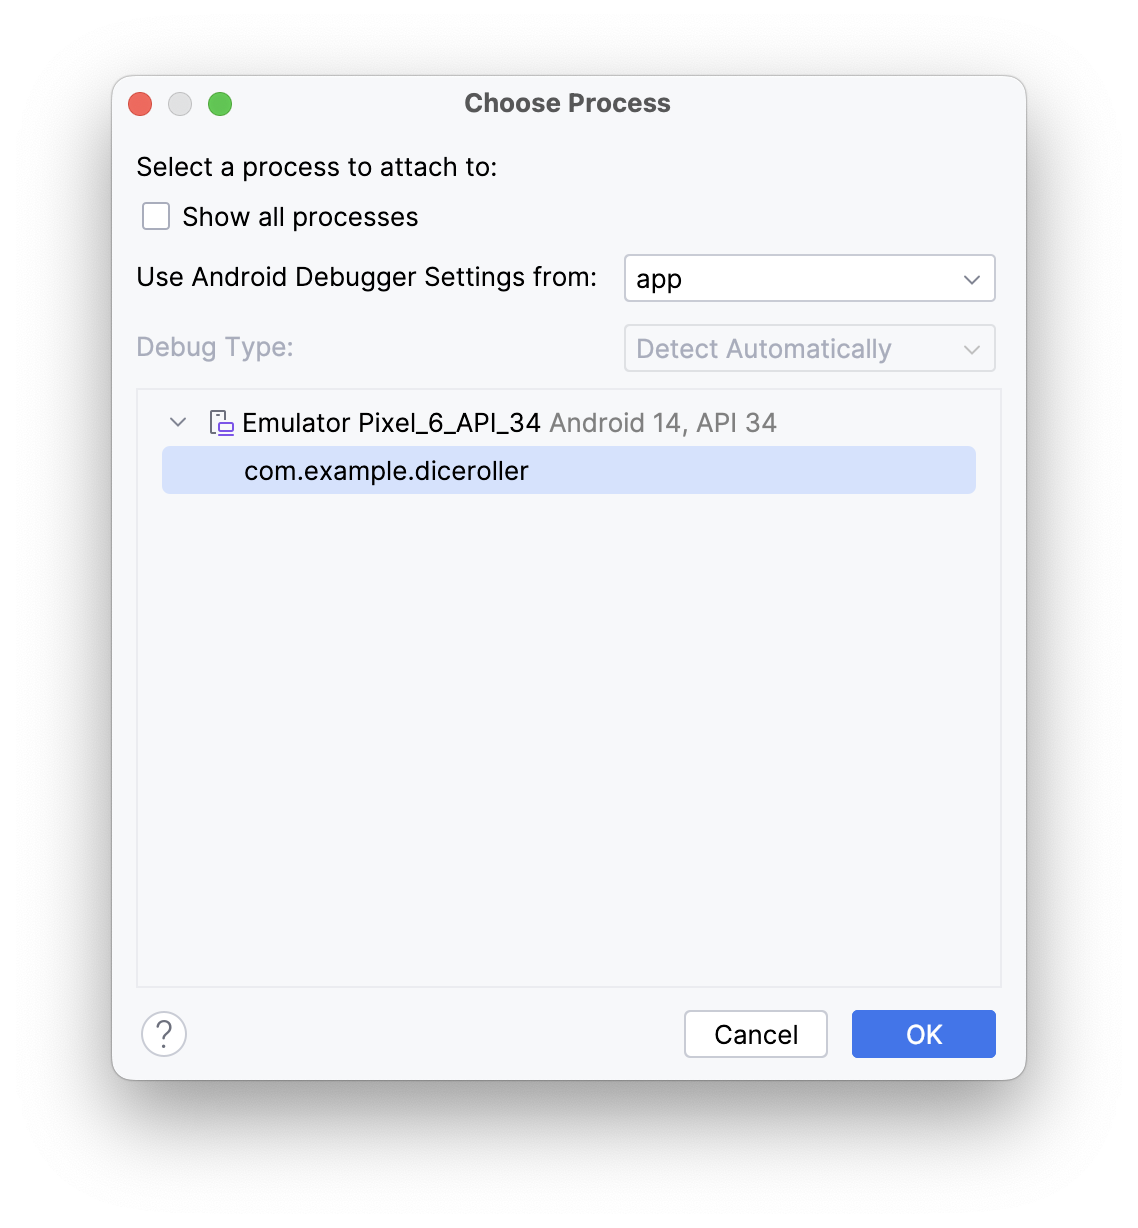
A Choose Process dialog opens in which you can choose the process to which you want to attach the debugger.
Select com.example.diceroller, click OK.
A Debug pane appears at the bottom of Android Studio with a message that indicates that the debugger is attached to the target device or emulator.
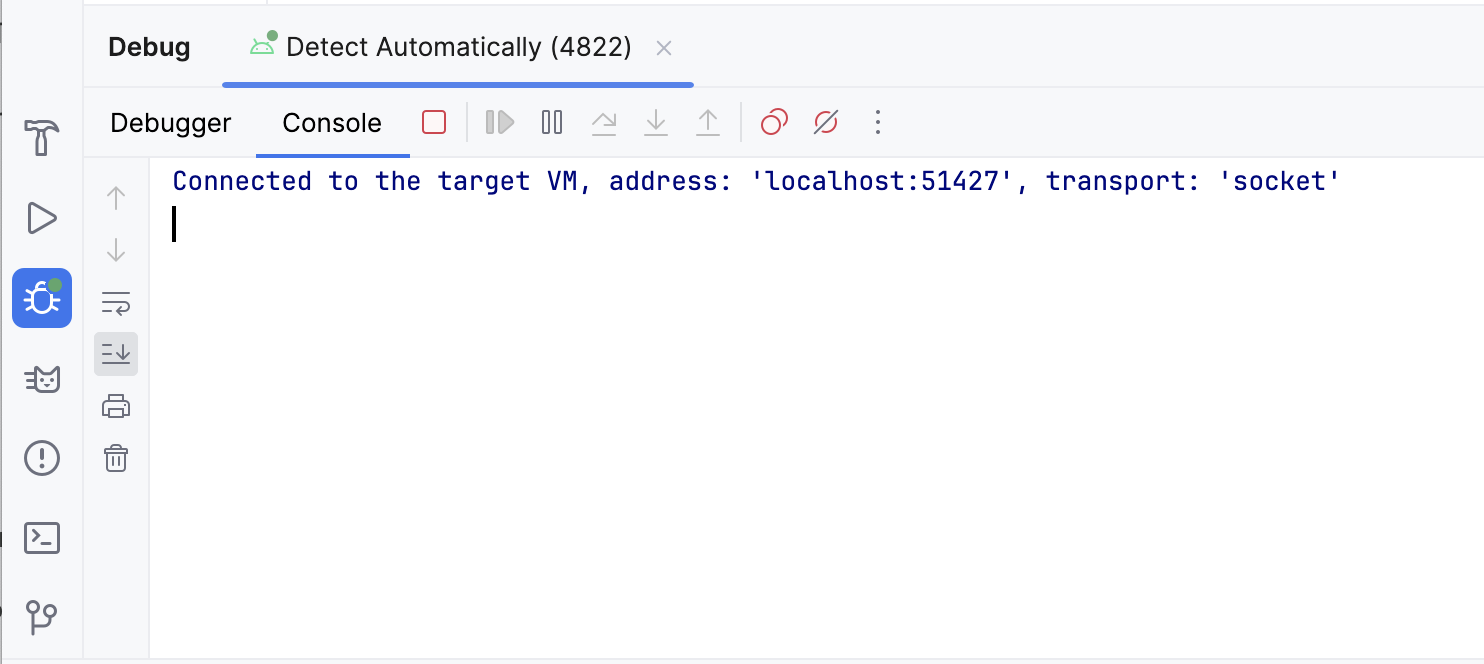
You attached the debugger to your app! Deets to be covered later. Next, you learn how to launch an app with the debugger already attached.
Run the app with the debugger
If you know that you want to use the debugger from the start, you can save time when you run the app with the debugger. Furthermore, if you want to debug code that only runs when the app launches, you need to launch the app with the debugger already attached.
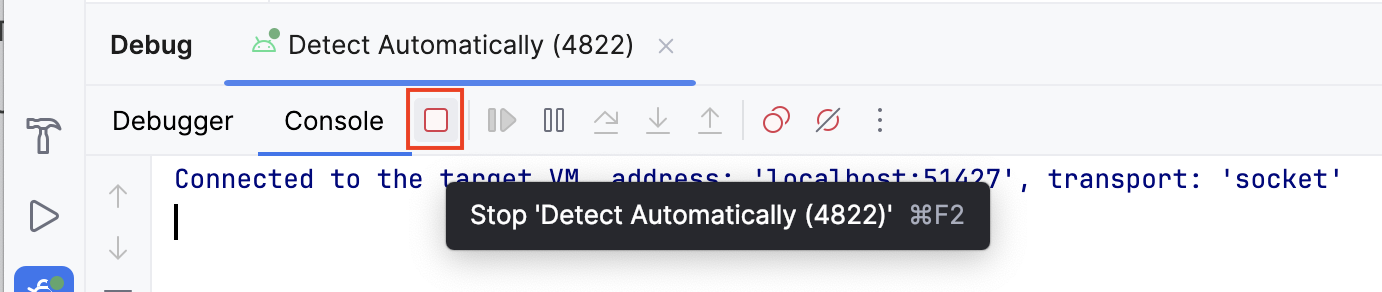
To run the app with the debugger, in the Debug pane, click Stop, which should close the app on the emulator.
Click Debug ‘app’.
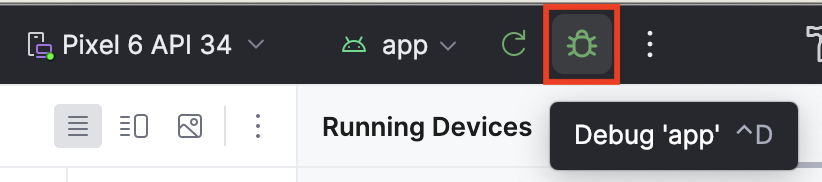
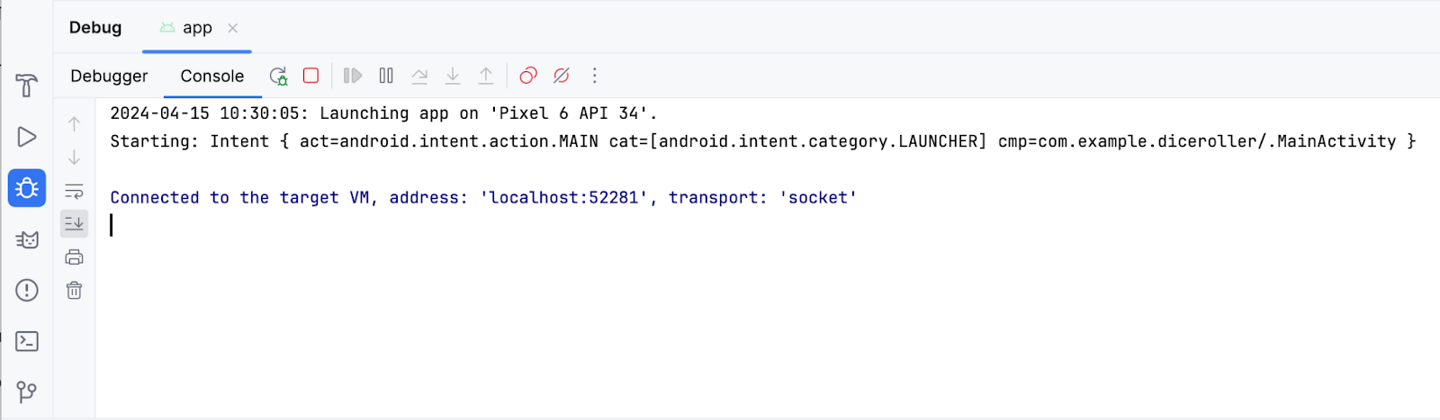
The same Debug pane appears at the bottom of Android Studio with some console output.
Use the debugger
The Debug pane
You likely noticed that there are quite a few buttons across the top of the Debug pane, but these buttons don’t mean much right now, and most are grayed out and unclickable. This section covers the more-commonly used features found in the debugger. This codelab explains the other buttons as they become relevant.
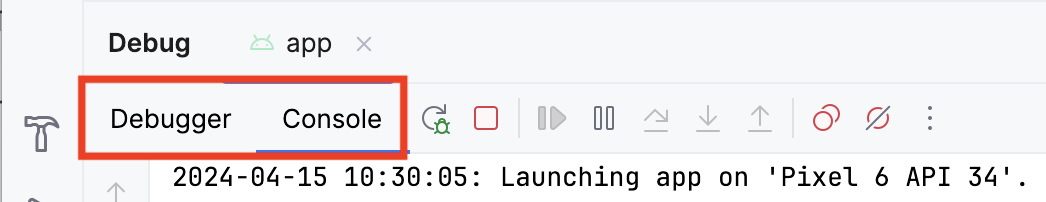
When you first launch the debugger, you see a number of buttons in the Debug pane. At the top of the Debug pane, you see the Debugger and Console buttons. On some versions of Android Studio, instead of Debugger, you see Threads & Variables. They are the same.
The Console button displays the logcat output of the app. If you have any log statements in your code, the output displays as that piece of code executes.
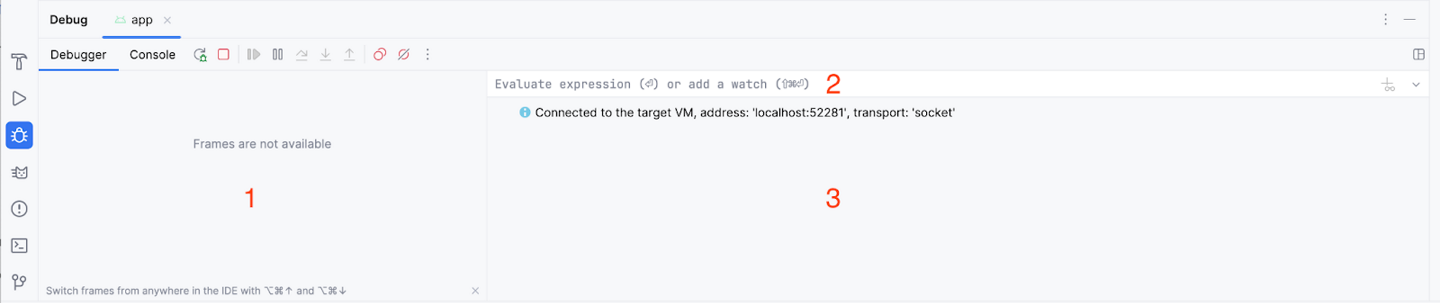
The Debugger (or Threads & Variables) button displays three separate panes, which are empty right now because you aren’t using the debugger:
Frames display
Evaluation and watch expression entry
Variables pane
Use common debugger features
Set a breakpoint
One of the main features of the debugger is that it lets you stop execution on a specific line of code with a breakpoint.
To set a breakpoint in Android Studio, you need to navigate to a specific line of code and then click in the gutter next to the line number. To unset a breakpoint, you need to click an existing breakpoint in the gutter to make it disappear.
Example: here a breakpoint is set at where
DiceRollerApp()is called.
Try it yourself. Set a breakpoint where the
imageResourcevariable is set, i.e. this line of code:val imageResource = when(result) {
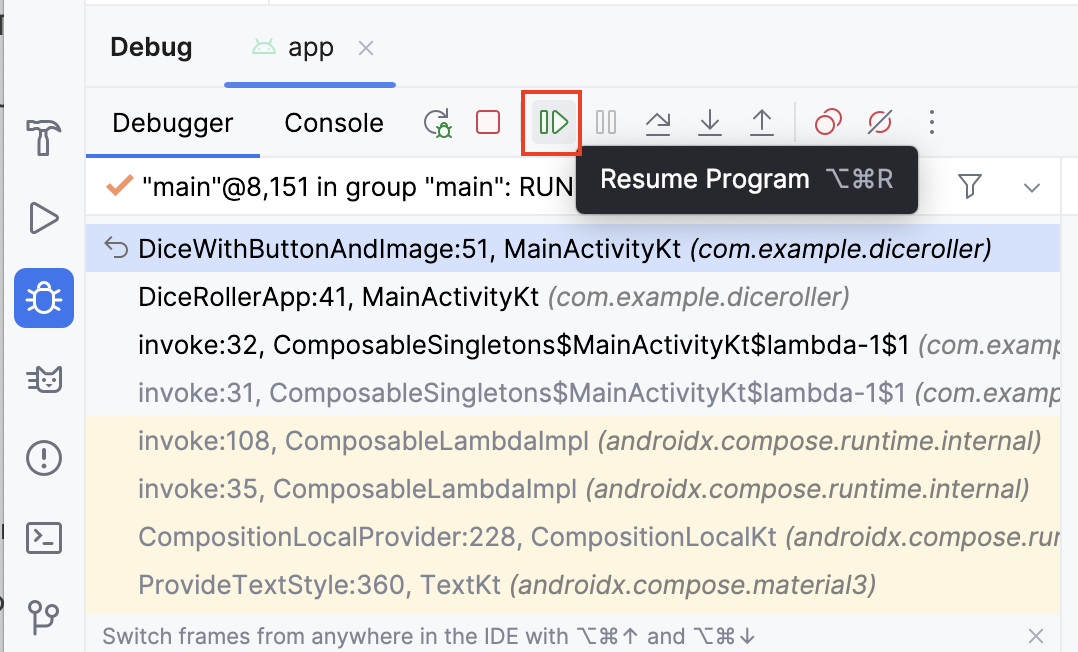
Use the Resume Program button
In the last section, you set a breakpoint where the
imageResourcevariable is set. This breakpoint causes the execution to suspend upon this instruction. When code execution is suspended with the debugger, you likely need to continue execution to continue running the app. The most direct way to do this is to use the Resume Program button.To resume the program, follow these steps.
Click Debug ‘app’. You should see something like this image after the app launches:
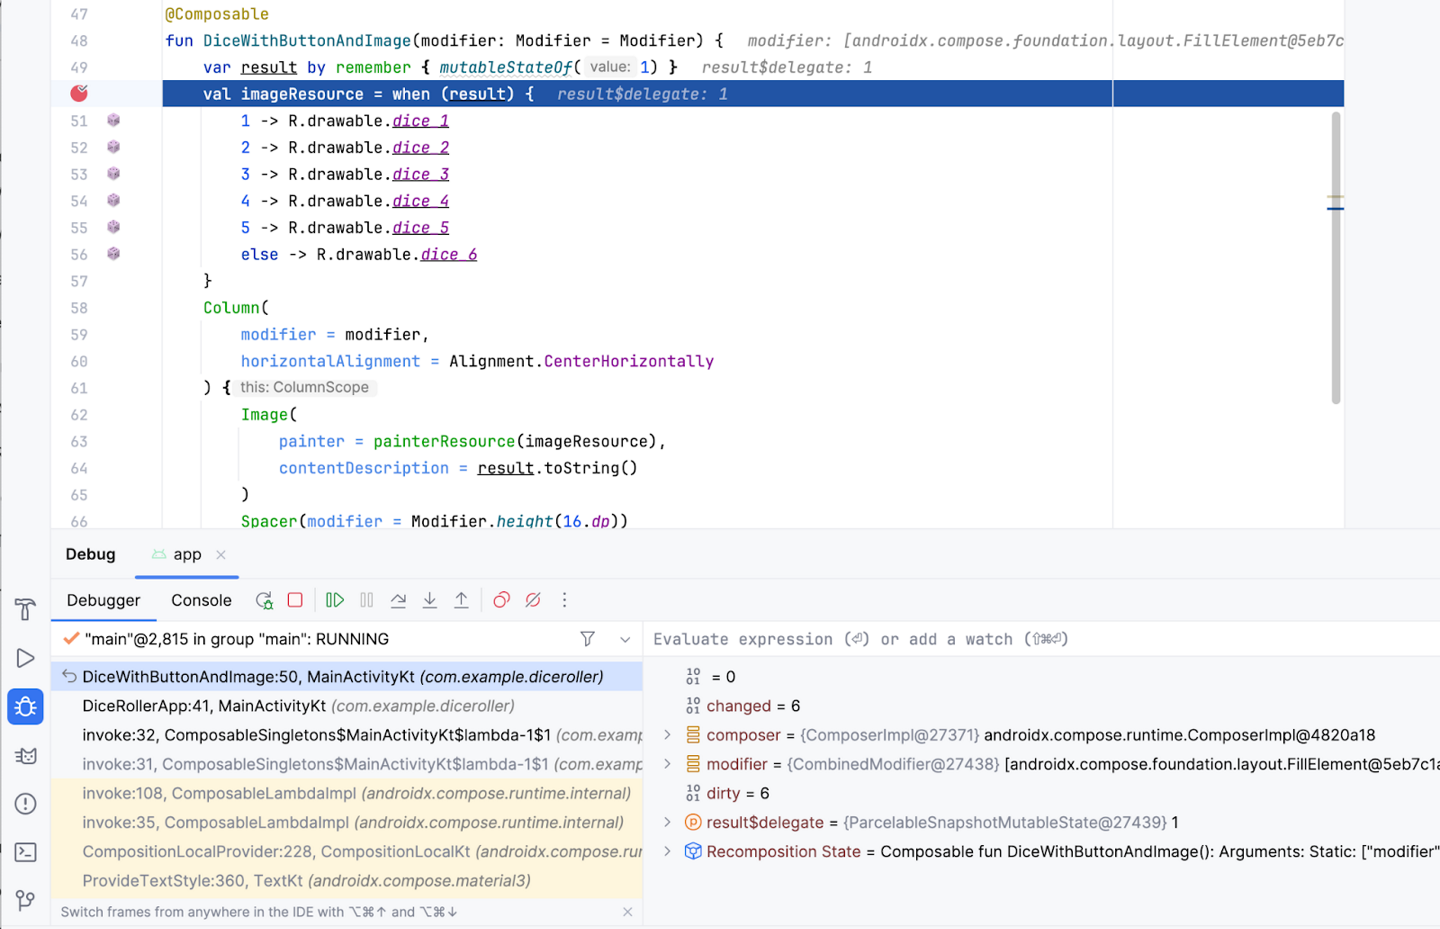
Before you resume the program, it’s important to explain some of what you see on the screen when the debugger suspends execution:
Many of the buttons in the Debugger (or Threads & Variables) pane are now clickable.
The Frames pane displays a lot of information, which includes a highlighted reference to the line where the breakpoint was set.
The Variables pane displays a number of items, but this app doesn’t have many variables so there isn’t a lot of information that is relevant in the scope of this codelab at the moment. However, the ability to inspect variables is an essential feature of the debugger because it yields insight into what happens in the code at runtime. This codelab goes into more detail about how to inspect variables later.
If you look at the app on your device or emulator, you notice that the screen is blank because the app is suspended on a line of code. More specifically, execution stopped at the breakpoint and the UI hasn’t yet rendered.
Bear in mind that the app won’t always stop immediately only because a breakpoint was set. It depends on where you place a breakpoint in the code. In this case, you placed it on a line that executes when the app starts.
The key thing to remember is that the app only suspends at a breakpoint when an attempt to execute the line at which the breakpoint was set occurs. There are multiple ways to move the debugger forward, but for now you use the Resume Program button.
Click Resume Program.
You should now see something that looks like this image:
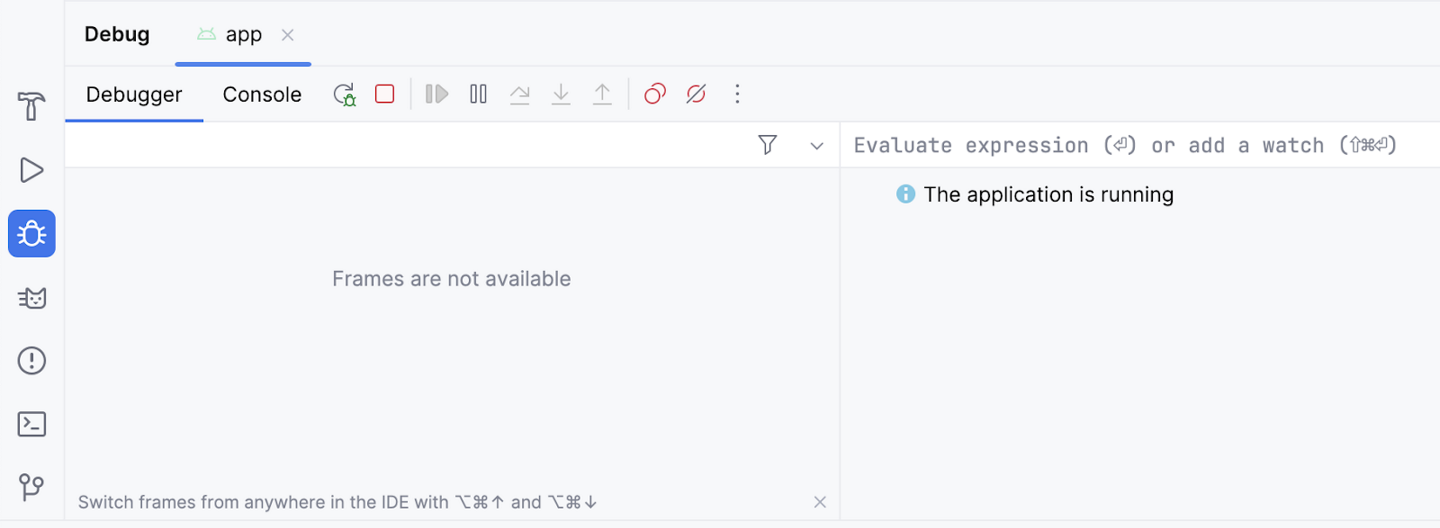
The majority of the information disappears and the buttons are once again unclickable. The app also appears as normal on your device or emulator. The reason for this is that the code is no longer suspended at the breakpoint and the app is in a normal running state. The debugger is attached, but it doesn’t do much until there’s an attempt to execute a line of code that has a breakpoint set. Leave this breakpoint in place because it’s useful in the following examples.
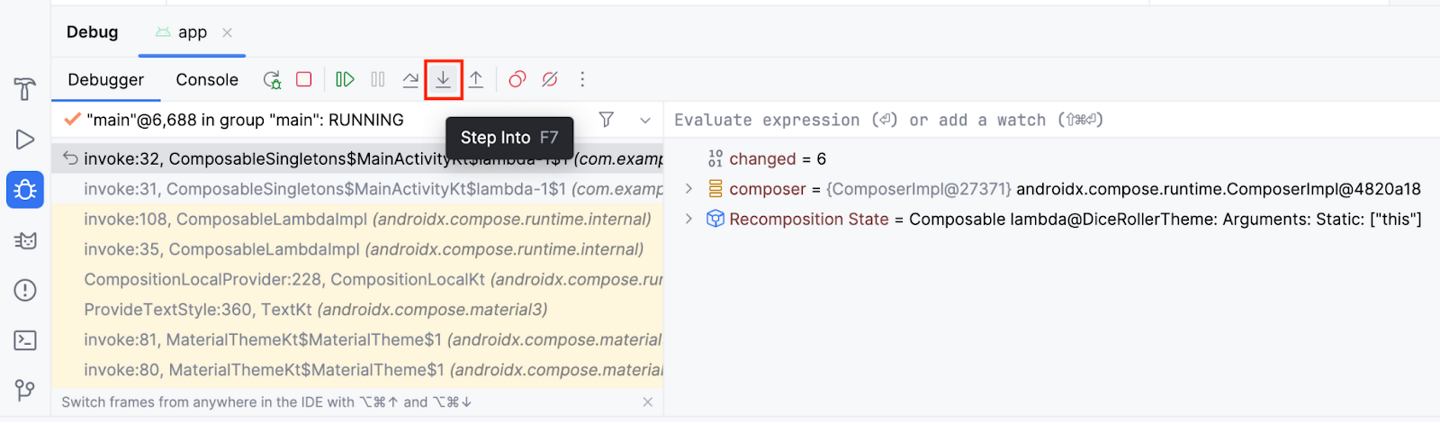
Use the Step Into button
The Step Into button of the debugger is a handy way to drill deeper into the code at runtime. If an instruction makes a call to a method or another piece of code, the Step Into button lets you enter the code without the need to navigate there manually before you launch the debugger to set a breakpoint.
Create a breakpoint in where the
DiceRollerApp()function is called.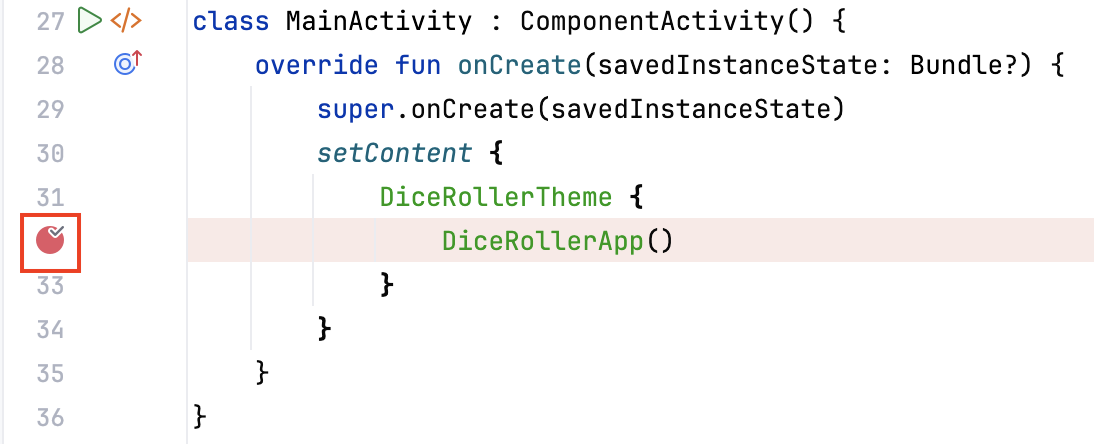
Click Debug ‘app’ to rerun the app with the debugger. The execution suspends at the line where the
DiceRollerApp()function is called.Note
If the execution doesn’t suspend, most likely your Android Studio version is 2024.1.1 or later. In that case, create a breakpoint inside
fun DiceRollerApp(), atDiceWithButtonAndImage(modifier = Modifier
Click Debug ‘app’ to rerun the app with the debugger.
The next steps will be different for you, try to understand what the steps are doing, and repeat them in your own Android Studio as far as possible.
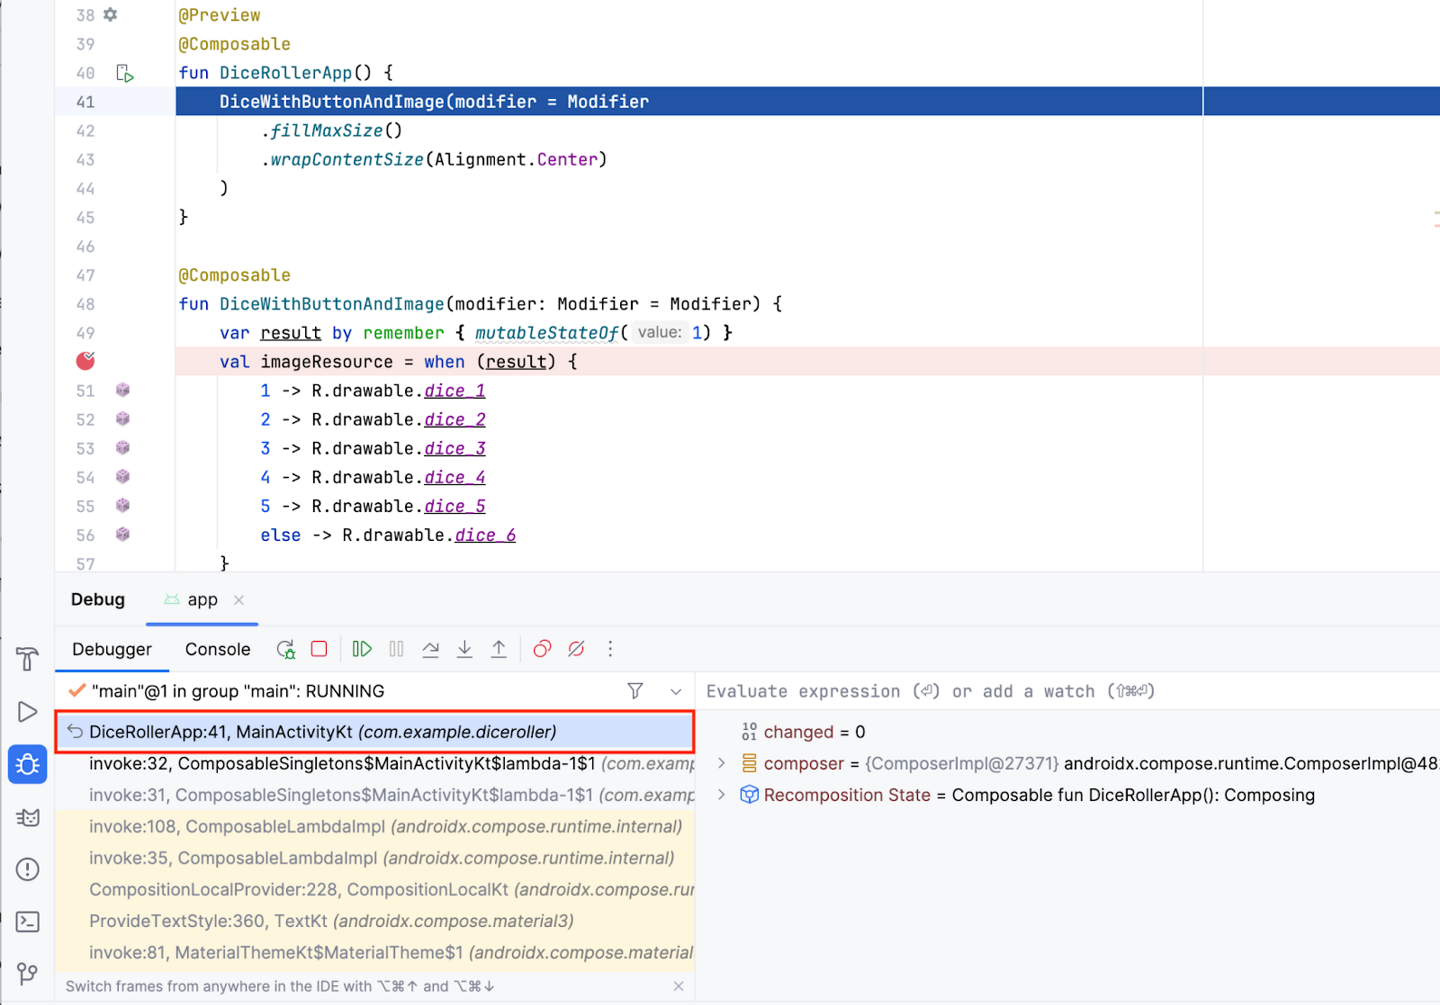
Click Step Into.
Now line 40 is highlighted and the Frames pane in the Debug pane indicates that the code is suspended on line 40.
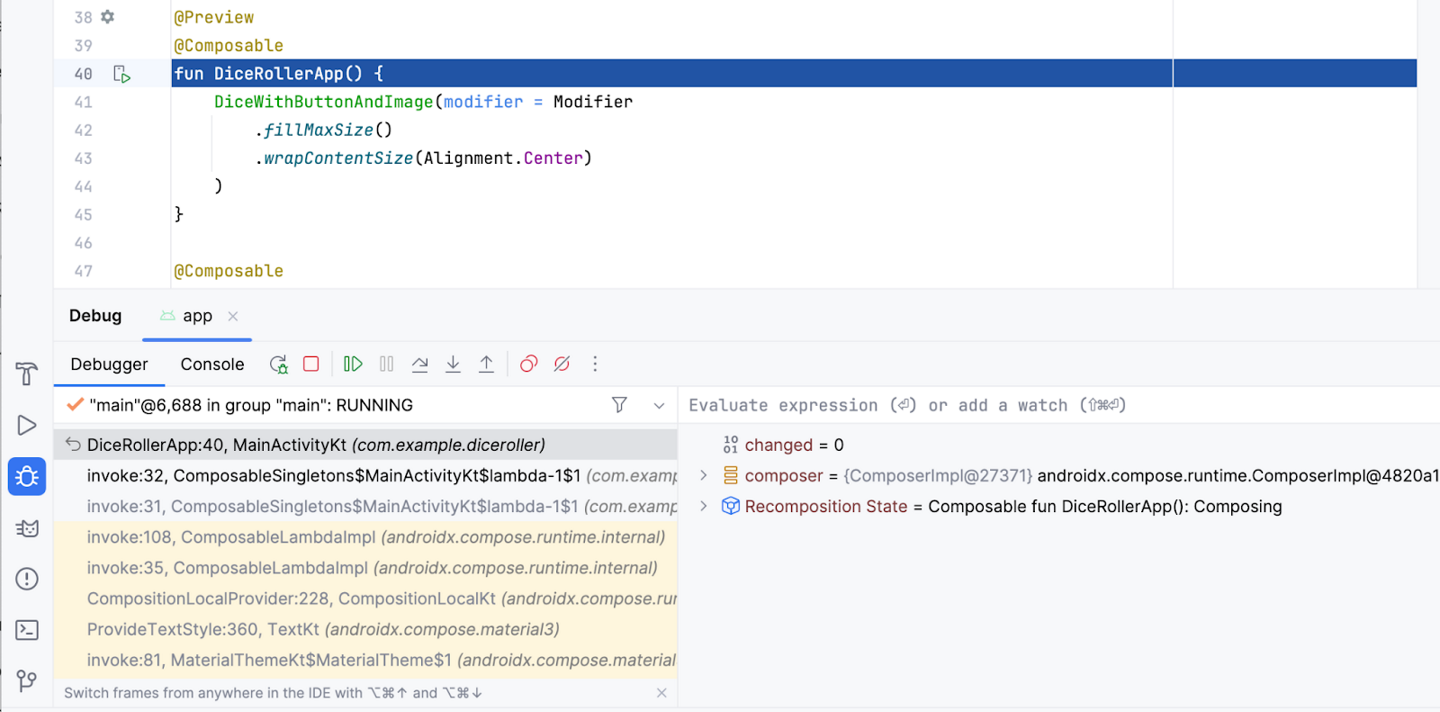
If you expand the Frames pane, you can see that the line after the highlighted line starts with invoke: followed by a line number, which is 32 in the previous image. This is what is referred to as the call stack. Essentially, it shows the chain of calls that lead the code execution to the current line. In this case, line 32 holds an instruction that calls the
DiceRollerApp()function.When you clicked the Step Into button when the debugger stopped at the breakpoint set on that function call, the debugger stepped into that function, which leads the execution to line 40 where the function is declared. The highlighted line indicates where the execution is suspended. If the lines after the highlighted line have line numbers associated with them, it’s an indication of the path of execution. In this particular case, the debugger indicates that an instruction on line 32 brought you to line 40.
Click Resume Program.
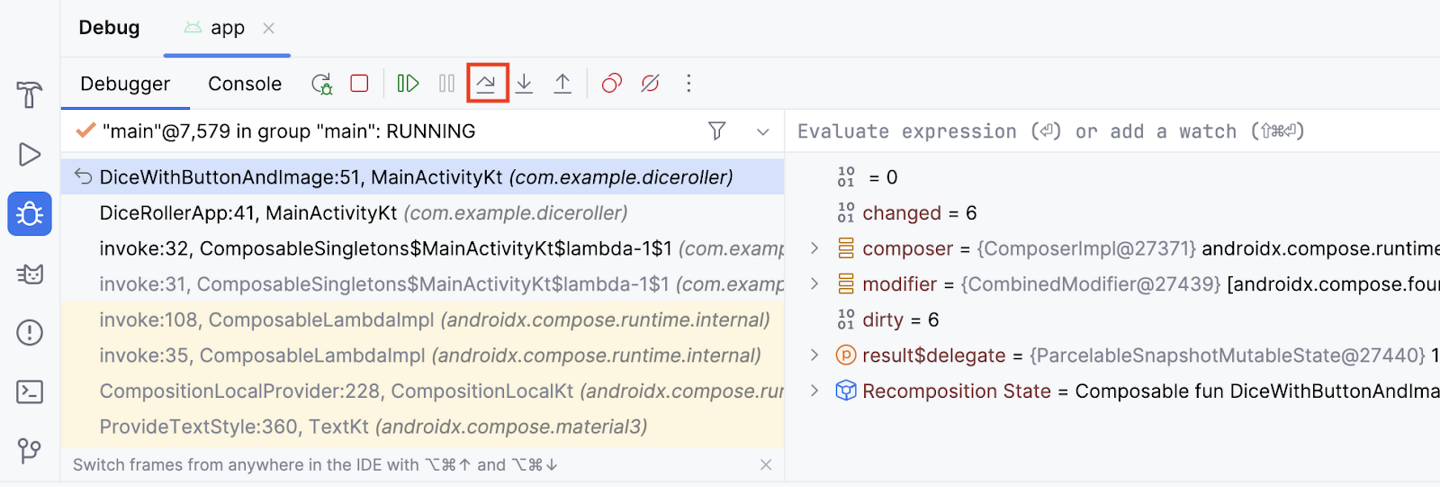
This should lead you to the original breakpoint that you set. You might understand a bit more about what you saw when you stopped execution in the first example. This is the same picture from the sixth step of the Resume program section:
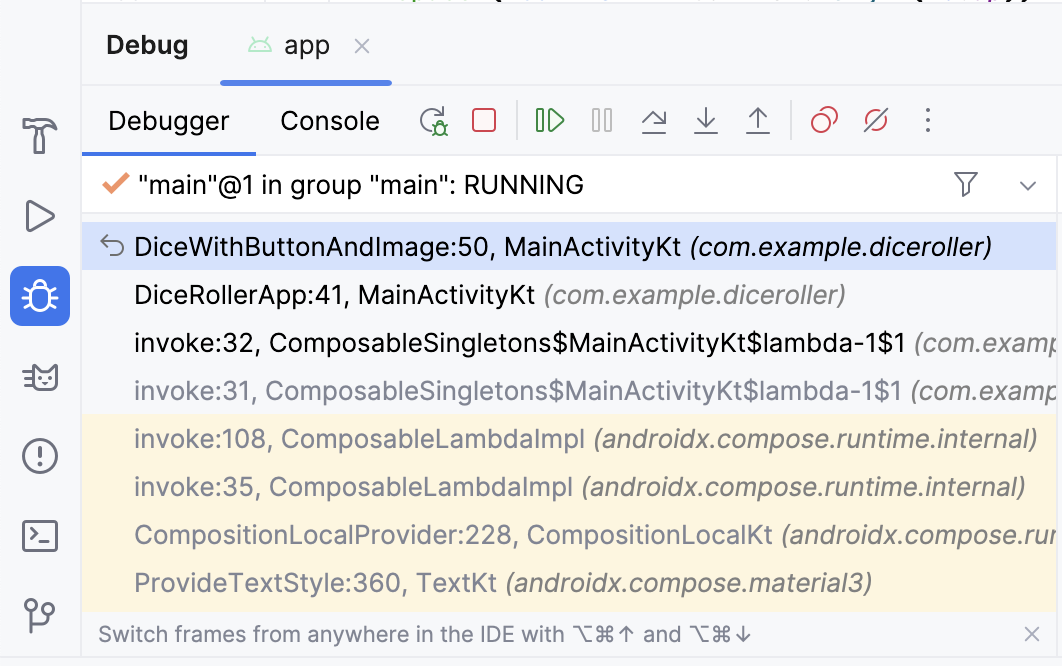
In the call stack, you can see that the
DiceWithButtonAndImage()function suspended on line 50 and the function was called from line 41 in theDiceRollerApp()function, which was called on line 32. The call-stack feature can help you understand the path of execution. This is very helpful when a function is called from many different places in the app.The Step Into button provides a way to enter a function and suspend the execution without setting a breakpoint in the function itself. In this case, you set a breakpoint on the call to the
DiceRollerApp()function. When you click the Step Into button, the execution suspends in theDiceRollerApp()function.Dice Roller is a fairly small app because there aren’t many files, classes, or functions. When you work with bigger apps, the Step Into feature of the debugger becomes more useful because it gives you the option to drill down into the code without the need to navigate the code on your own.
Use the Step Over button
The Step Over button provides another means by which you can step through your app code at runtime. It moves the execution to the next line of code and advances the debugger.
Click Step Over.
You now see that the debugger suspended the code on the next line of execution, which is line 51. You can proceed to step through each line, consecutively.
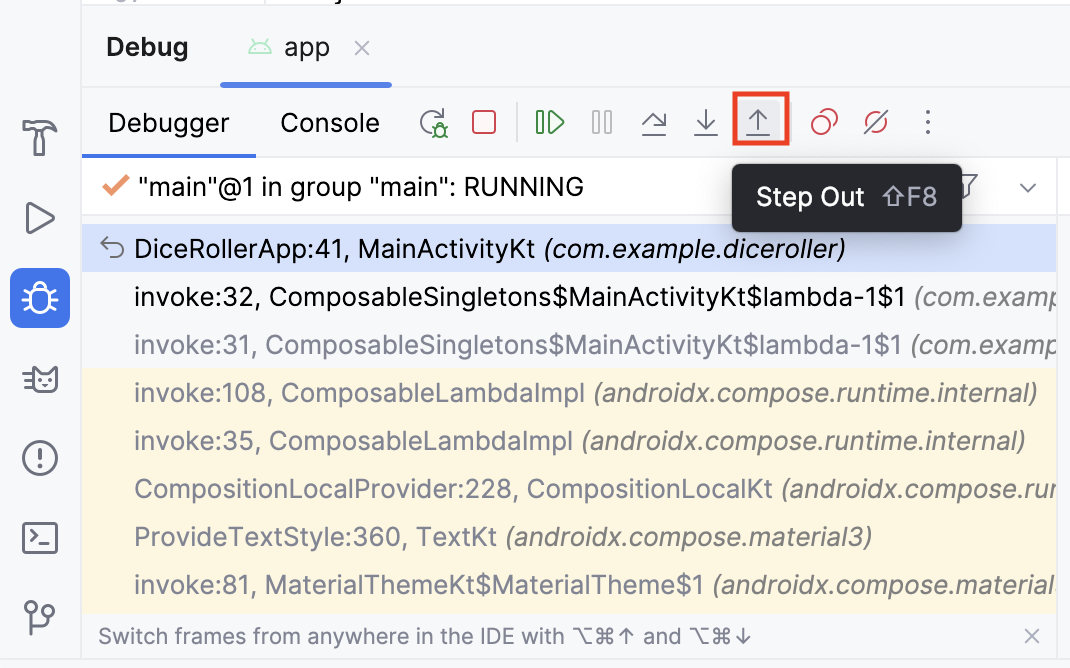
Use the Step Out button
The Step Out button does the opposite of the Step Into button. Rather than drill down into the call stack, the Step Out button navigates up the call stack.
Click Step Out. Can you guess what line the program suspends on?
Notice that the debugger stepped out of the
DiceRollerApp()function and back to the line that called it.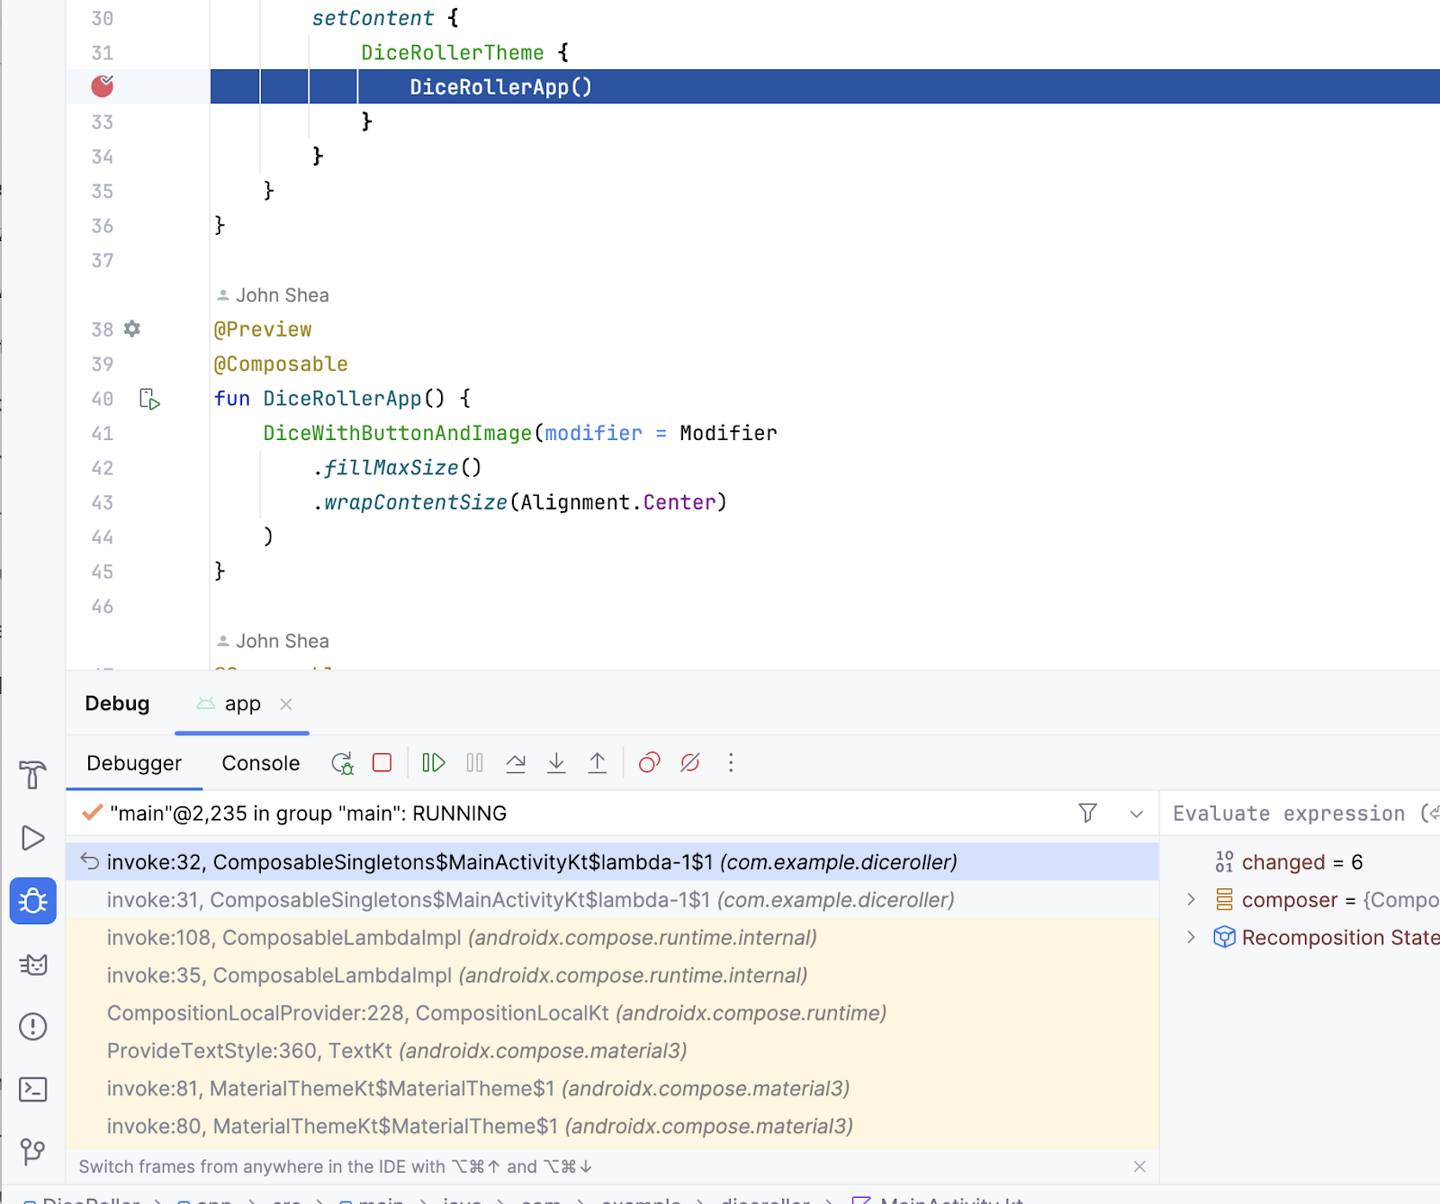
The Step Out button is a useful tool when you find yourself too deep in a method call stack. It lets you work your way up the call stack without the need to step through all the code for each method that you stepped into.
Inspect variables
Earlier in the codelab, there was a brief description of the Variables pane, which provides a more in-depth explanation of how to inspect the variables shown in the pane to help you debug issues in your app.
Click the breakpoint to remove it from where the
DiceRollerApp()function is called, but leave the breakpoint where theimageResourcevariable is set.Click Debug ‘app’. You should see that the
result$delegatevariable is aMutableStatewith a value of 1. That is because when the variable is defined, it is instantiated with amutableStateOf1.MutableStatemeans that the result variable holds a state that can be changed.Note
The
result$delegatevariable in the Variables pane refers to theresultvariable in the code. The$delegatenotation is there because the result variable is arememberdelegate.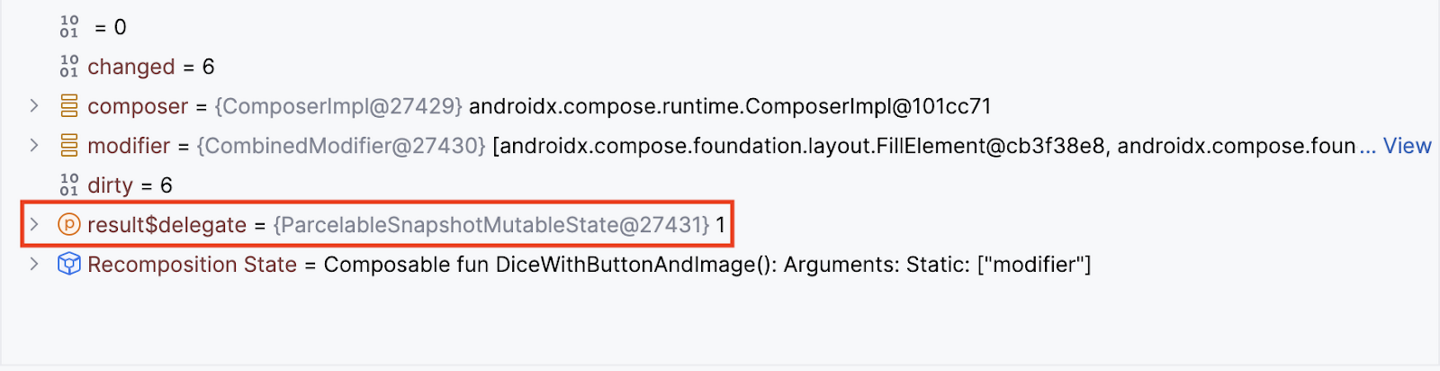
Click Resume Program.
In the app, click Roll. Your code suspends at the breakpoint again and you may see a different value for the
result$delegatevariable.In this image, the mutable state of the
result$delegatevariable holds a value of 2. This demonstrates how you can inspect variables at runtime with the debugger. In a more full-featured app, the value of a variable could potentially cause a crash. When you use the debugger to inspect variables, you can gain more insight into the details of the crash so that you can fix the bug.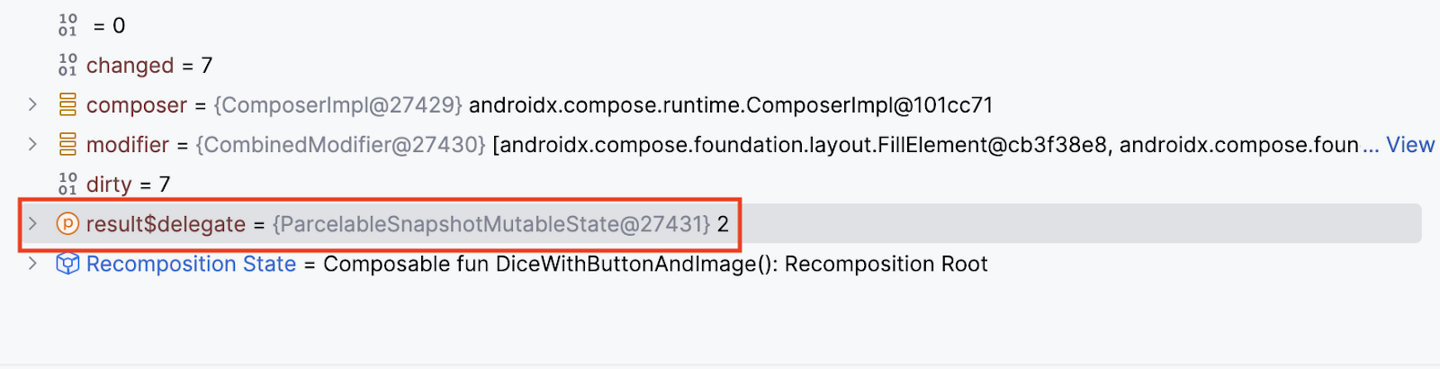
Conclusion
Attach the debugger to an app.
Launch an app with the debugger already attached.
Gain familiarity with the debugger pane.
Set a breakpoint.
Resume the program from the debugger.
Use the Step Into button.
Use the Step Over button.
Use the Step Out button.
Inspect variables with the debugger.